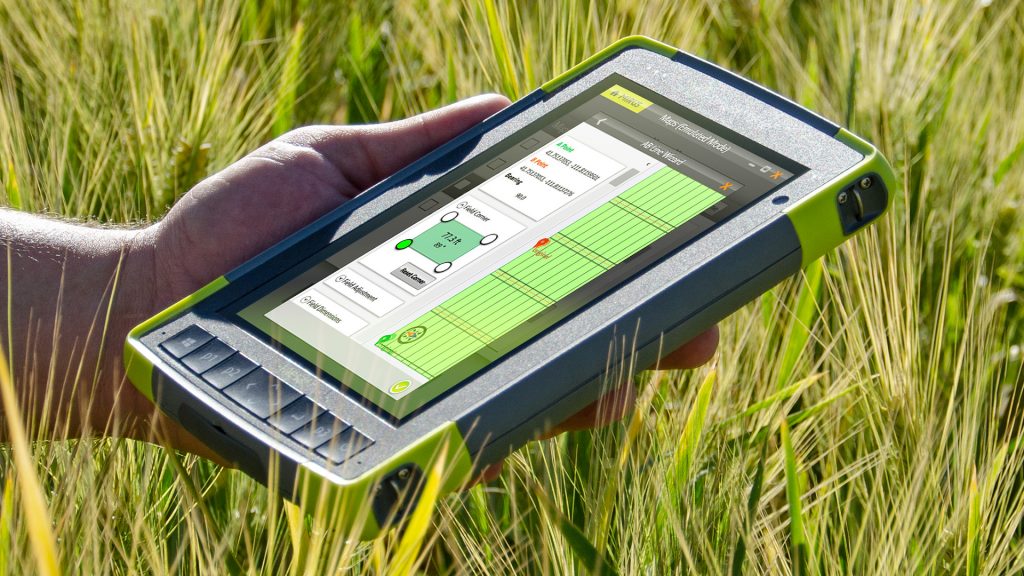
HarvestMaster™ first launched Mirus™ in 2012 in response to users wanting a more flexible, clean data collection software. With technology advancing so rapidly over the last few decades, agricultural researchers could collect more data than ever. The new volume of data needed to be paired with software that was faster and accessible on larger screens. HarvestMaster saw this need and worked hard to develop Mirus, a data collection software compatible with Windows devices. Modeled after its forebearers, Mirus has the same workflow, making the transition between interfaces easy for researchers used to older software.
Mirus is an innovative software that HarvestMaster has developed for seed researchers to make data collection faster and easier than ever. Mirus is compatible with most Windows devices. Mirus maximizes the information users collect while minimizing mistakes and the time spent during setup and compilation.
When paired with a GrainGage™ from HarvestMaster, users can see data and trends while harvesting. The GrainGage can collect accurate plot weight, moisture, and test weight measurements, all while the combine is still running. Mirus allows users to see this data in real-time and even take notes while harvesting. Note-taking allows for more accurate observations because users can attach notes to specific plots and improves communication between operators and researchers.
A Screen for Every Need
To help researchers get the most out of Mirus, HarvestMaster developers have made it so that users can customize their screen to show up to four different sets of data at a time. With this quad-view screen, users can make Mirus their own by selecting any of the following screens that are most relevant to them while harvesting.
- Information Screen: Shows live data from the most recently harvested plot.
- Graphs: Presents the average yield, average moisture, and average test weight in graph form.
- List: Displays accumulating data in spreadsheet format.
- Cycle: Tracks the plot, weight, moisture, and test weight for each cycle.
- Spatial Screen: This option can be color-coded to show the varying degrees of selected data throughout the field. For example, heat maps for yield, moisture, weight, or test weight. This is the only screen where you can have multiple spatial screens populate the quad screens. All four quads can be a spatial screen showing different data.
- Real-Time Weight: Displays live data of the weight in the GrainGage. Allowing users to see the minimum and maximum weight and at what weight the bucket will cycle before overflowing.
- Diagnostics: Allows users to monitor the sensors between each plot.
- Field Screen: This screen appears when using the GNSS plugin. Users can see their real-time position in the field and navigate to specific plots. This screen also shows distance, speed heading, and other GPS data.
Users can generate field maps on the fly or import them in a CSV format. When finished collecting data, users can then export their maps and all their data out to excel for further analysis. Mirus also stores all the maps users have created to save time by avoiding repeated creation.
Discover Plugins
Mirus doesn’t just help users during harvest time. With this field ready software, it’s easier than ever to map plots, plant seeds, and apply chemicals to plots. Making Mirus the ultimate all-season software for researchers. HarvestMaster allows Mirus to be even more customizable to users by offering multiple plugin options. Find out which of these will help you work most efficiently.
GNSS
Take the guesswork out of the operator’s hands with this plugin. With GNSS, users can more accurately create and navigate their fields using GPS location. Users can set the boundaries of their fields and the dimensions of their plots more accurately with this plugin. This plugin minimizes time spent measuring and set up and eliminating the use of wheels, tape measuring, and location guessing.
FIELD APPLICATOR
This featured plugin allows users to automate the use of their sprayers and fertilizers. This plugin saves money and time by allowing users to operate up to 24 different tanks of spray treatments at a time. With the map already set up using GPS location, this plugin knows where to spray which fertilizers, all operators have to do is drive. Eliminate human error and operating time with this plugin.
CONE PLANTER
Say goodbye to tedious and time-consuming cable and hand tripping, with the Cone Planter plugin, seeding becomes quick and automated. Data from the seeds is gathered before planting, which generates maps that can be exported and used later. Seed researchers can quickly switch between different seeds while planting and can plant anywhere from 4-8 rows at a time.
ZEBRA LABEL PRINTER:
Stay organized with this plugin by labeling samples as you harvest. Users can customize their labels to include data and plot information Mirus has collected for each sample. The hardware for this plugin can be put right into the cab of the combine for convenient labeling.
POLYTECH NIR SENSOR
Combine Polytec NIR software with Mirus for more in-depth data collection. This plugin allows users to conveniently control the NIR sensor and store all its collected data within Mirus. Using near-infrared light, researchers can assess the nutrient content of the grains right at harvest as well as moisture.
Make It Your Own
Mirus can do all this and more. The plugins listed above are just a few examples of add-ons that are available for Mirus. HarvestMaster works closely with its users to find the best combination of plugins for their needs, even if that means customized plugins. Contact us now to find out how Mirus can transform your research.

